Colorado's Down-Ballot Data Visualizer
Explore the State of Colorado’s proposition and amendment races.
Understanding how votes add up matters. It matters for big races, but it matters for smaller, down-ballot races too.
The Colorado down-ballot vote visualizer is a tool to be used in the pursuit of understanding down-ballot voting trends in Colorado races. The visualization tools this site offers are meant to lend a hand to journalists covering these races and to voters seeking more information about how support for state-level issues has changed over time.
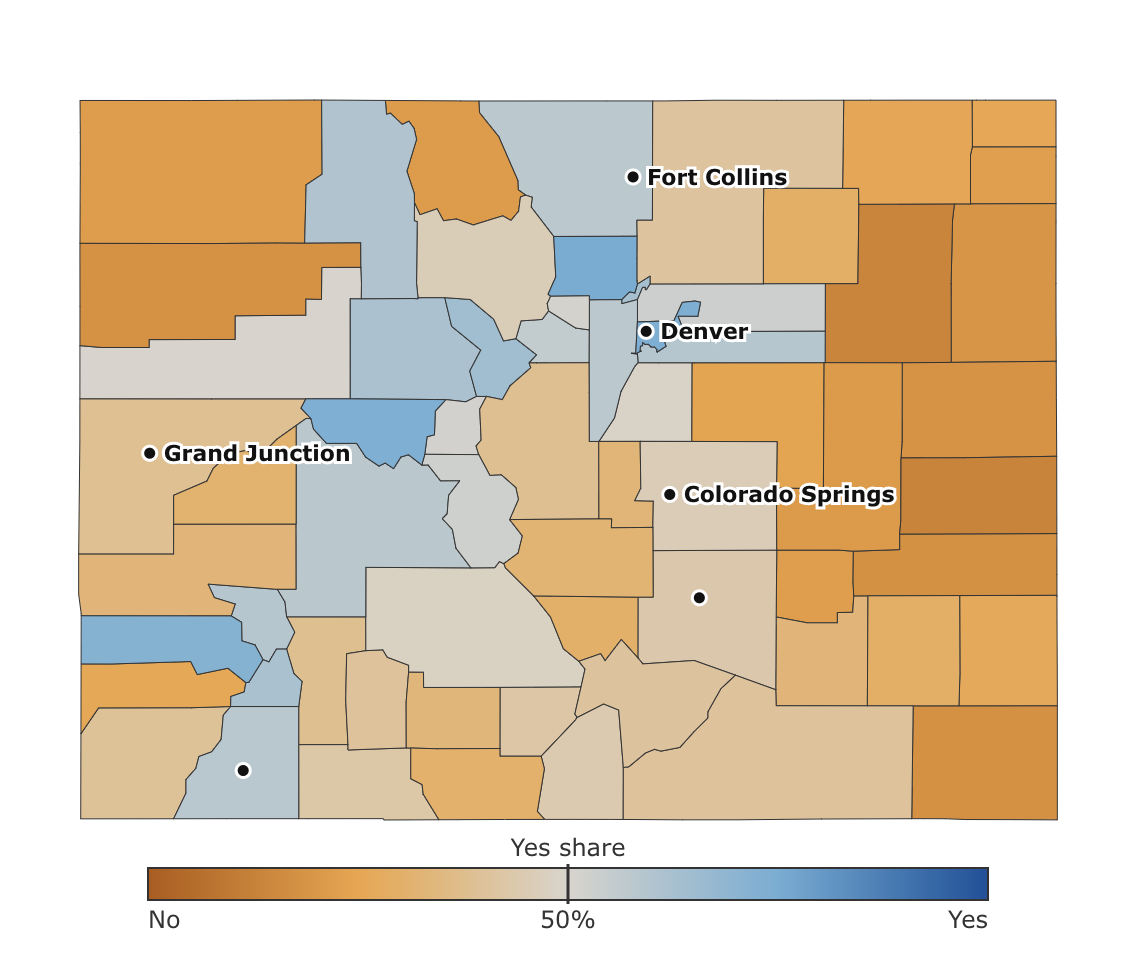
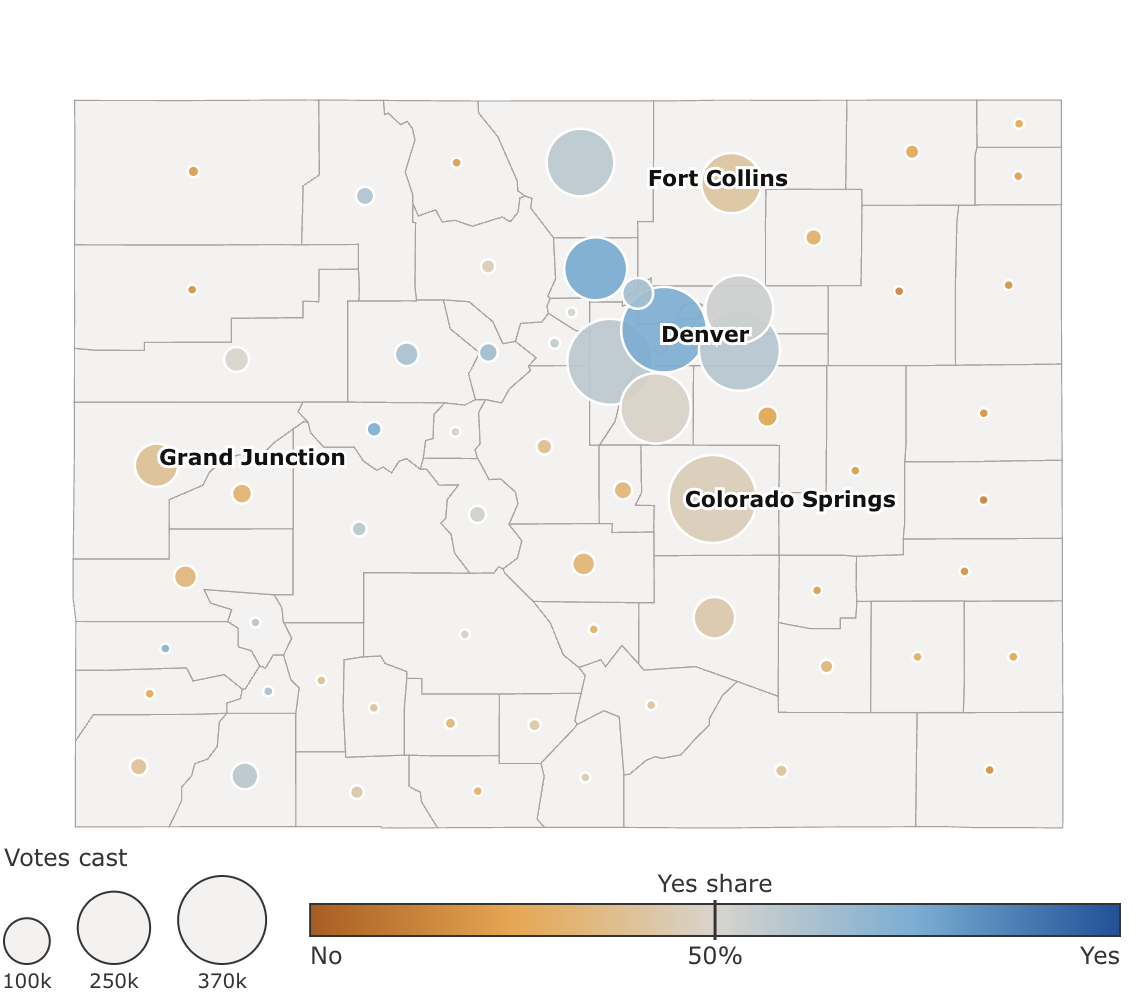
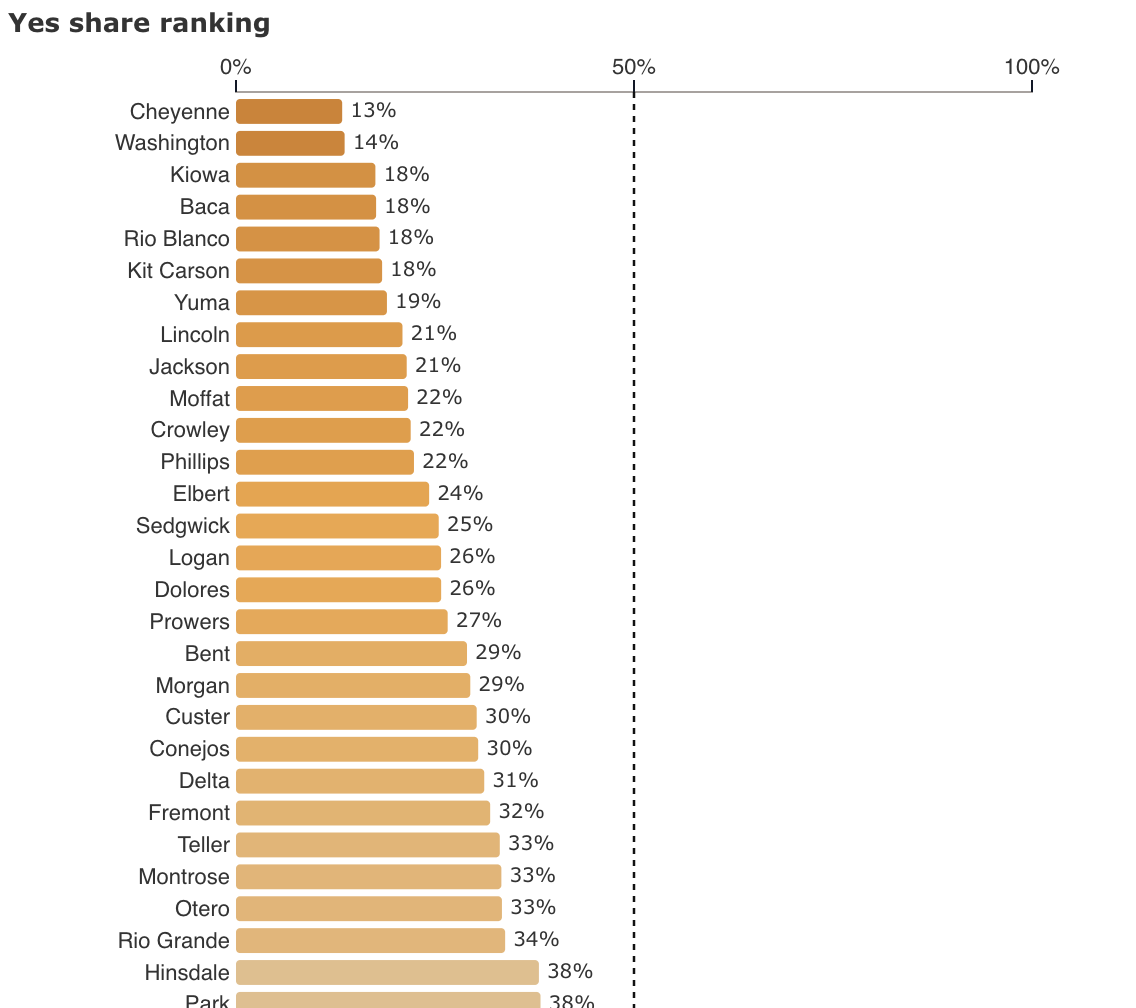
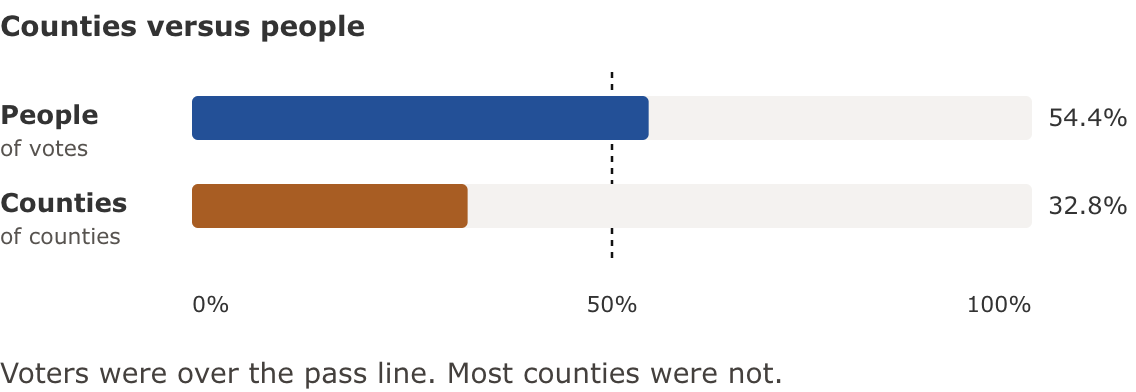
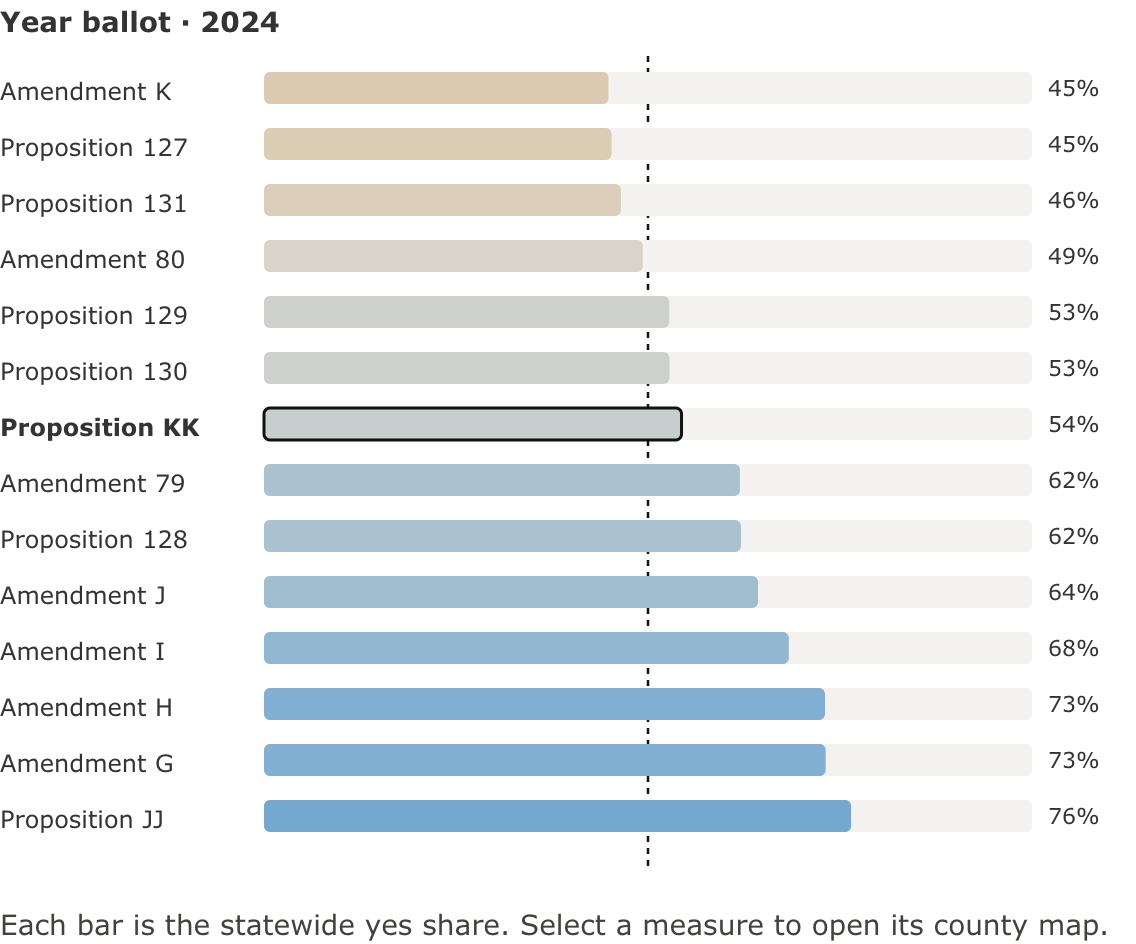
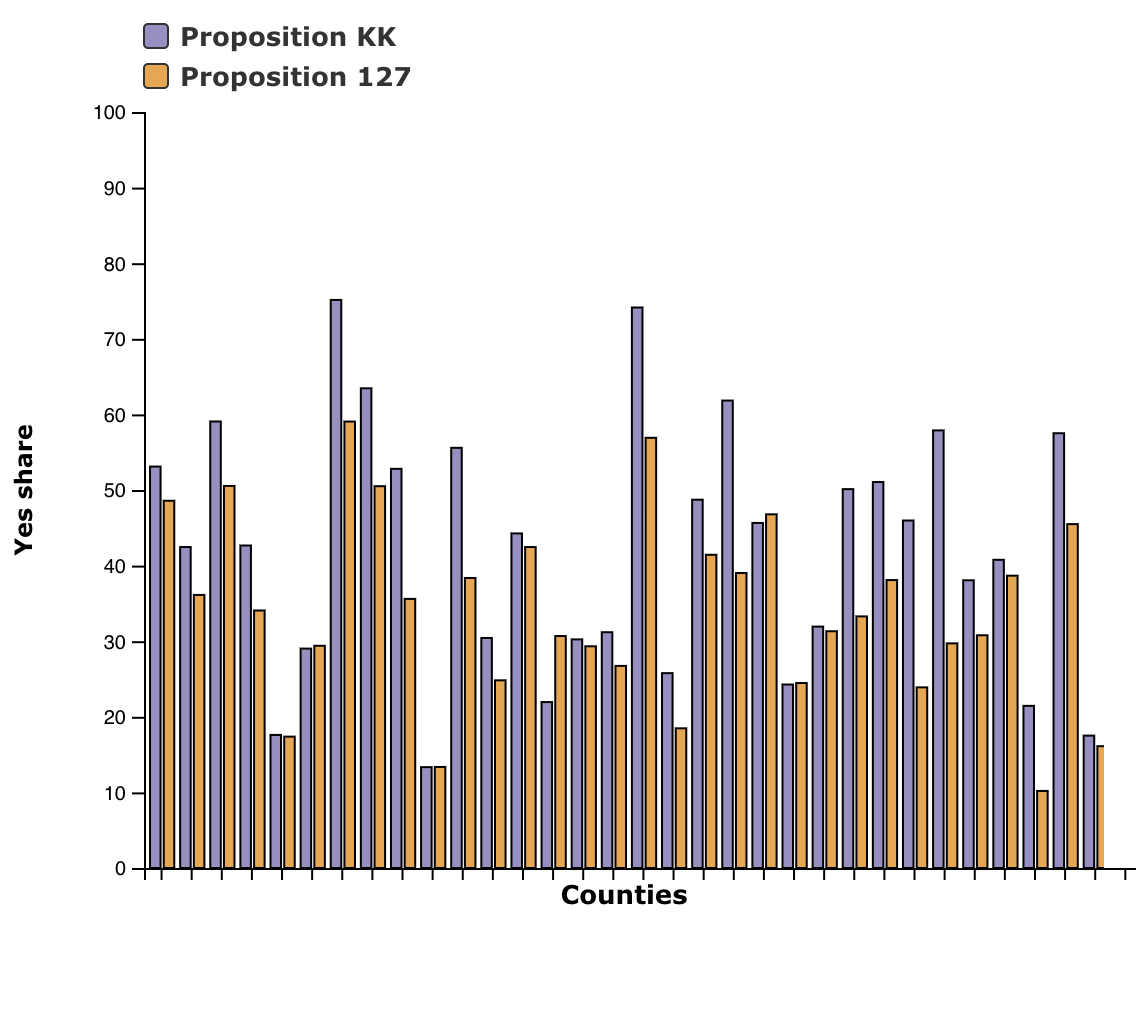
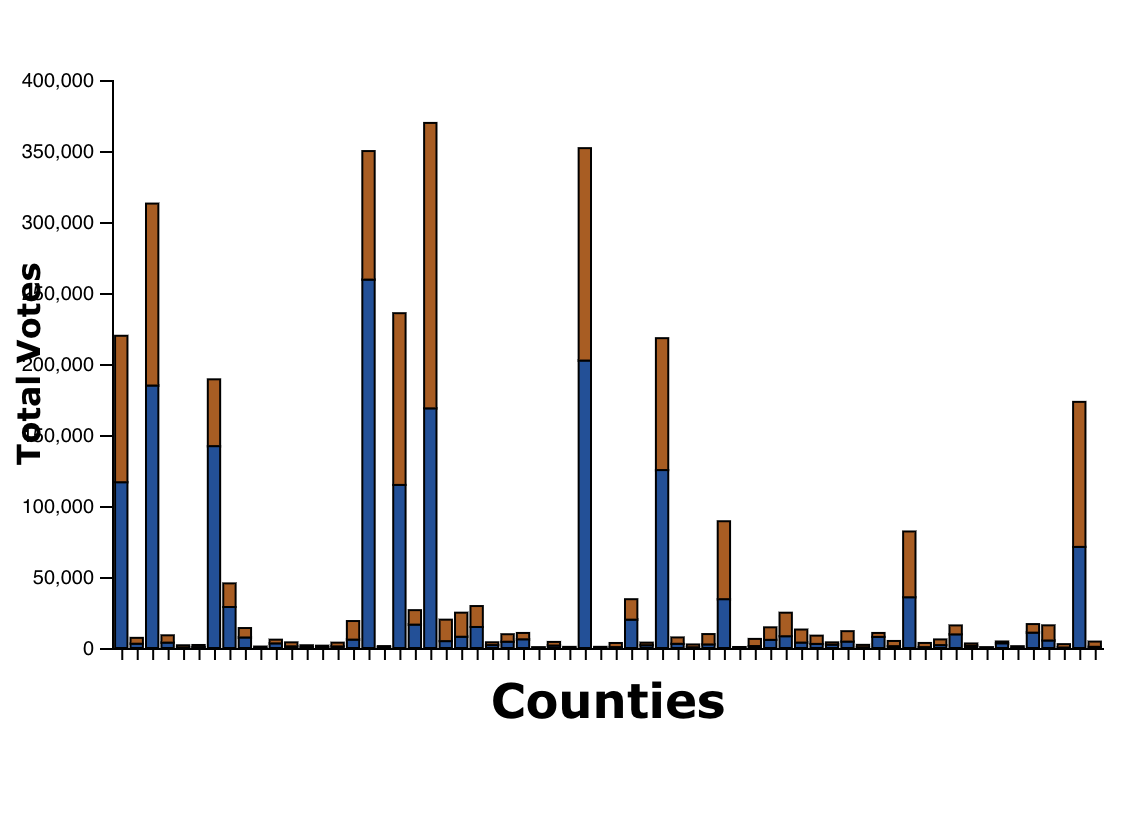
The County map shows how each county voted. The Vote size map sizes each county by the votes cast. Yes share ranking orders counties from the strongest no to the strongest yes. Counties versus people puts the share of votes next to the share of counties. The Year ballot shows every measure in one year. County vote totals stacks the yes and no votes. Compare two measures puts two propositions side by side.
These visualizations can be exported in their entirety and used in local election reporting. All the data for these visualizations comes from the Colorado Secretary of State’s elections data. Find out more about how this data was sourced here.